
European flight disruption report: October 2026
Final figuresIn October 2026, 1.33% of the 270,269 departures we tracked at 51 European airports were cancelled or reached their destination more than three hours late: 3,600 flights, of which 2,105 were cancellations. Tunisair had the highest disruption rate of any airline with at least 400 departures (13.25%). Among the largest carriers, LOT Polish Airlines was the most reliable (0.38%). Barcelona (BCN) was the most disrupted airport at 4.05%.
- of departures disrupted
- 1.33%
- flights cancelled or 3h+ late
- 3,600
- cancellations
- 2,105
- arrivals 3+ hours late
- 1,495
- departures tracked at 51 airports
- 270,269
- EU 261 compensation owed, one passenger per flight
- €445,800
- average arrival delay of 3h+ flights
- 4h 26m
- airlines in the ranking
- 64
Day by day
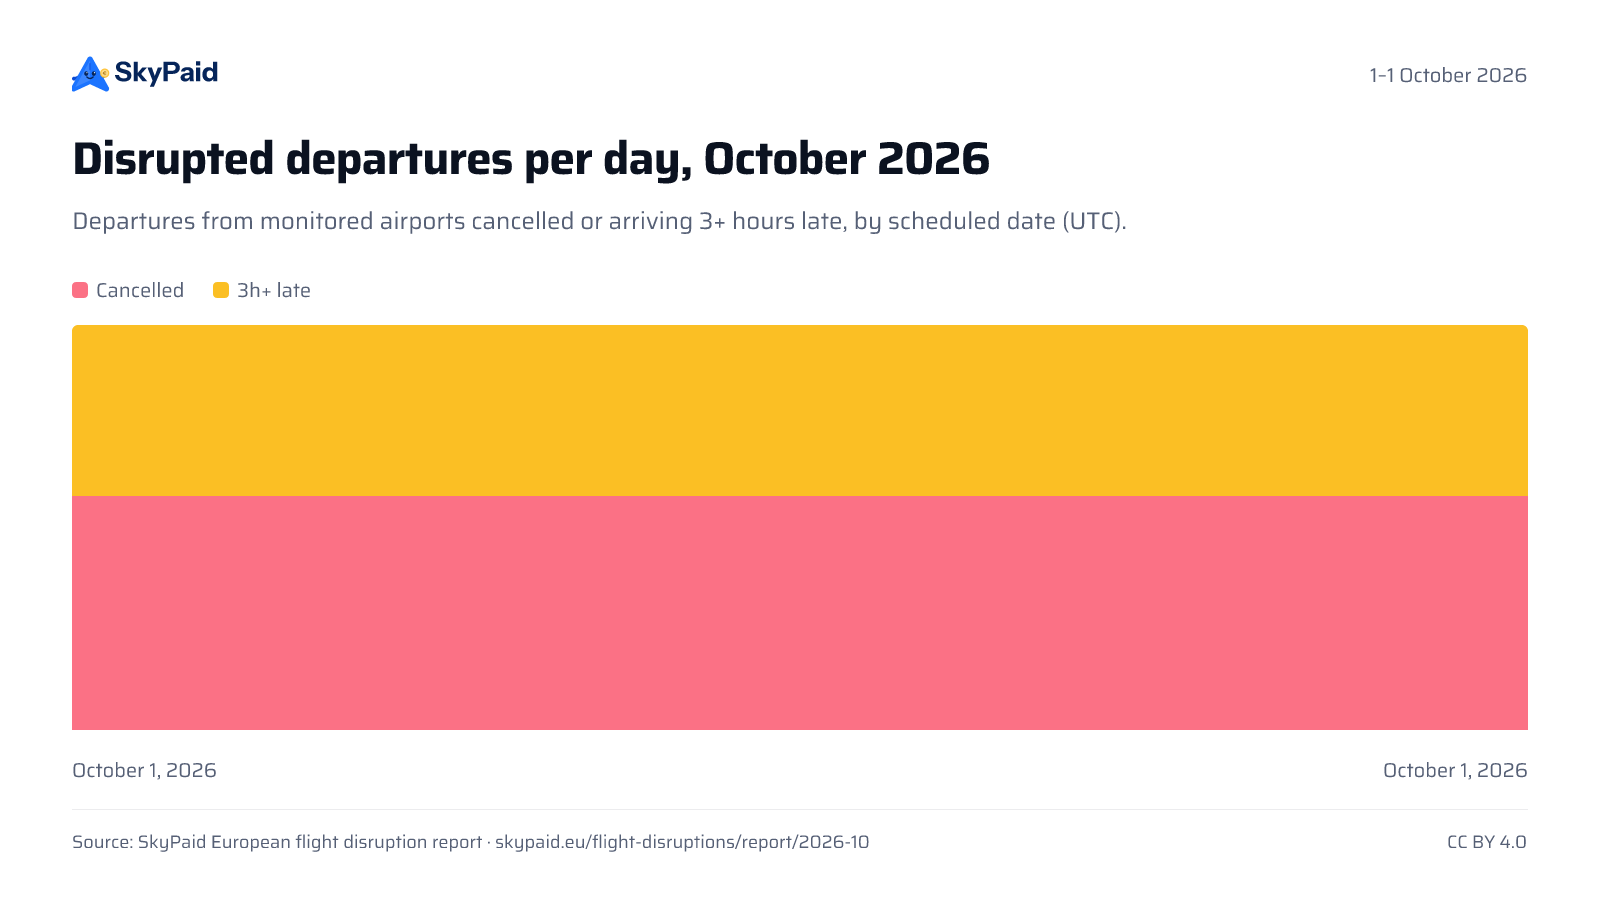
When the disruptions happened
Departures from monitored airports that were cancelled or reached their destination at least three hours late, by scheduled departure date (UTC).
- Cancelled
- 3h+ late
Worst day: 16 October 2026, with 246 cancellations and 173 flights 3+ hours late.
Largest airlines
How the biggest carriers compared in October 2026
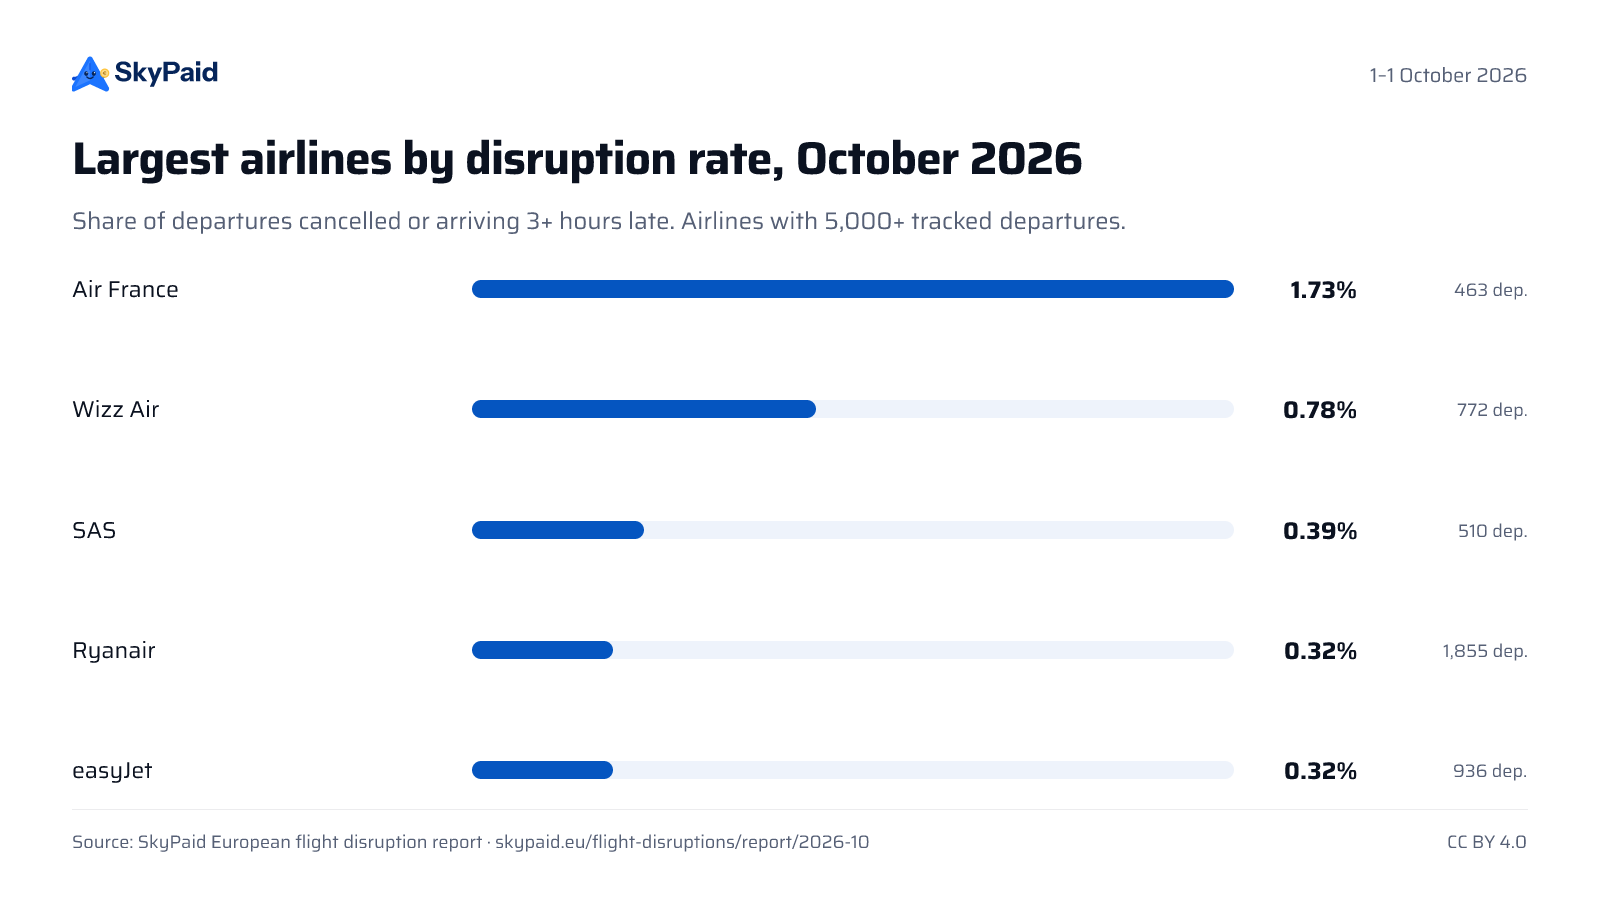
Airlines with at least 5,000 tracked departures, most disrupted first.
| # | Airline | Departures | Cancelled | 3h+ late | Disruption rate | Claim |
|---|---|---|---|---|---|---|
| 1 | Vueling | 10,323 | 337 | 112 | 4.35% | |
| 2 | easyJet | 23,214 | 367 | 133 | 2.15% | |
| 3 | Wizz Air | 21,322 | 137 | 236 | 1.75% | |
| 4 | ITA Airways | 5,779 | 49 | 17 | 1.14% | |
| 5 | Air France | 13,777 | 96 | 53 | 1.08% | |
| 6 | Transavia | 7,384 | 60 | 15 | 1.02% | |
| 7 | Ryanair | 51,167 | 87 | 399 | 0.95% | |
| 8 | Iberia | 11,611 | 78 | 22 | 0.86% | |
| 9 | SAS | 10,068 | 67 | 11 | 0.77% | |
| 10 | TAP Air Portugal | 6,330 | 18 | 20 | 0.60% | |
| 11 | Norwegian | 7,345 | 26 | 13 | 0.53% | |
| 12 | Austrian Airlines | 7,305 | 28 | 7 | 0.48% | |
| 13 | LOT Polish Airlines | 7,108 | 17 | 10 | 0.38% |
Airline ranking
Every airline, ranked by disruption rate
64 airlines with at least 400 tracked departures. The rate is the share of their departures that were cancelled or arrived 3+ hours late.
| # | Airline | Departures | Cancelled | 3h+ late | Disruption rate | Claim |
|---|---|---|---|---|---|---|
| 1 | Tunisair | 400 | 11 | 42 | 13.25% | |
| 2 | Air Corsica | 537 | 27 | 6 | 6.15% | |
| 3 | KLM | 2,908 | 143 | 16 | 5.47% | |
| 4 | United Airlines | 934 | 30 | 15 | 4.82% | |
| 5 | Vueling | 10,323 | 337 | 112 | 4.35% | |
| 6 | Brussels Airlines | 3,206 | 91 | 3 | 2.93% | |
| 7 | British Airways | 4,385 | 72 | 30 | 2.33% | |
| 8 | easyJet | 23,214 | 367 | 133 | 2.15% | |
| 9 | Air China | 636 | 9 | 4 | 2.04% | Flights |
| 10 | American Airlines | 1,132 | 14 | 6 | 1.77% | |
| 11 | Air Dolomiti | 569 | 9 | 1 | 1.76% | Flights |
| 12 | Wizz Air | 21,322 | 137 | 236 | 1.75% | |
| 13 | Smartwings | 597 | 0 | 10 | 1.68% | Flights |
| 14 | Air Canada | 540 | 1 | 8 | 1.67% | Flights |
| 15 | Condor | 632 | 7 | 3 | 1.58% | Flights |
| 16 | Delta Air Lines | 1,233 | 13 | 6 | 1.54% | |
| 17 | FLYONE | 464 | 0 | 7 | 1.51% | |
| 18 | SWISS | 2,213 | 28 | 3 | 1.40% | |
| 19 | ITA Airways | 5,779 | 49 | 17 | 1.14% | |
| 20 | Air Arabia | 534 | 2 | 4 | 1.12% | Flights |
| 21 | Air France | 13,777 | 96 | 53 | 1.08% | |
| 22 | Transavia | 7,384 | 60 | 15 | 1.02% | |
| 23 | Ryanair | 51,167 | 87 | 399 | 0.95% | |
| 24 | Eurowings | 2,646 | 19 | 6 | 0.94% | |
| 25 | Air Algérie | 895 | 1 | 7 | 0.89% | |
| 26 | Lufthansa City | 562 | 4 | 1 | 0.89% | Flights |
| 27 | Iberia | 11,611 | 78 | 22 | 0.86% | |
| 28 | LATAM Airlines | 466 | 1 | 3 | 0.86% | Flights |
| 29 | Luxair | 618 | 3 | 2 | 0.81% | Flights |
| 30 | SAS | 10,068 | 67 | 11 | 0.77% | |
| 31 | airBaltic | 694 | 2 | 3 | 0.72% | Flights |
| 32 | Pegasus | 1,554 | 9 | 2 | 0.71% | Flights |
| 33 | Aeroitalia | 981 | 2 | 5 | 0.71% | Flights |
| 34 | Wideroe | 423 | 3 | 0 | 0.71% | Flights |
| 35 | Egyptair | 420 | 0 | 3 | 0.71% | Flights |
| 36 | Lufthansa | 4,550 | 23 | 9 | 0.70% | |
| 37 | El Al | 645 | 0 | 4 | 0.62% | Flights |
| 38 | TAP Air Portugal | 6,330 | 18 | 20 | 0.60% | |
| 39 | Air Europa | 4,035 | 9 | 14 | 0.57% | |
| 40 | Volotea | 1,395 | 1 | 7 | 0.57% | |
| 41 | Aer Lingus | 1,274 | 4 | 3 | 0.55% | |
| 42 | Norwegian | 7,345 | 26 | 13 | 0.53% | |
| 43 | Finnair | 1,348 | 3 | 4 | 0.52% | |
| 44 | Nouvelair | 406 | 0 | 2 | 0.49% | Flights |
| 45 | Austrian Airlines | 7,305 | 28 | 7 | 0.48% | |
| 46 | Royal Air Maroc | 1,119 | 3 | 2 | 0.45% | Flights |
| 47 | HiSky | 459 | 1 | 1 | 0.44% | |
| 48 | Aegean Airlines | 4,016 | 10 | 7 | 0.42% | |
| 49 | Jet2 | 4,222 | 3 | 14 | 0.40% | |
| 50 | Ethiopian Airlines | 495 | 0 | 2 | 0.40% | Flights |
| 51 | LOT Polish Airlines | 7,108 | 17 | 10 | 0.38% | |
| 52 | Qatar Airways | 1,045 | 0 | 4 | 0.38% | |
| 53 | ASL Airlines | 1,077 | 0 | 4 | 0.37% | Flights |
| 54 | SunExpress | 821 | 1 | 2 | 0.37% | Flights |
| 55 | SKY express | 1,964 | 7 | 0 | 0.36% | Flights |
| 56 | Turkish Airlines | 2,938 | 3 | 6 | 0.31% | |
| 57 | TAROM | 1,303 | 0 | 4 | 0.31% | |
| 58 | Emirates | 1,221 | 0 | 3 | 0.25% | Flights |
| 59 | KM Malta Airlines | 797 | 0 | 2 | 0.25% | Flights |
| 60 | Etihad Airways | 508 | 0 | 1 | 0.20% | Flights |
| 61 | TUI Airways | 1,860 | 0 | 3 | 0.16% | |
| 62 | AirSERBIA | 716 | 1 | 0 | 0.14% | Flights |
| 63 | Enter Air | 870 | 0 | 0 | 0.00% | Flights |
| 64 | AJet | 511 | 0 | 0 | 0.00% | Flights |
Airport ranking
Most and least disrupted airports
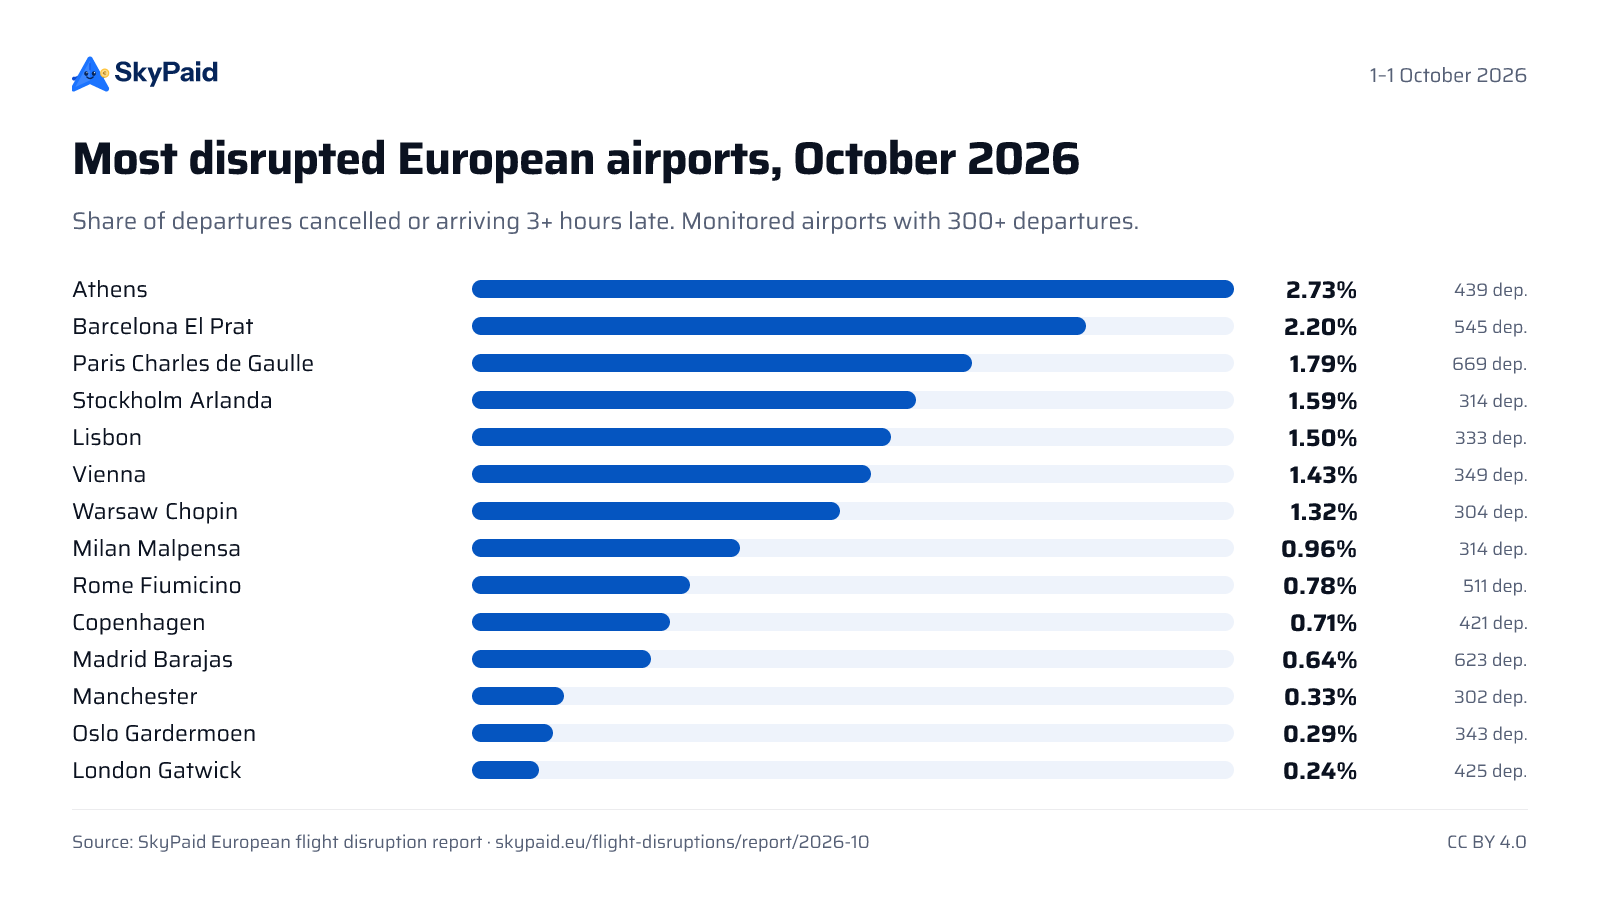
Monitored airports with at least 300 departures. Figures cover departing flights only.
| # | Airport | Departures | Cancelled | 3h+ late | Disruption rate |
|---|---|---|---|---|---|
| 1 | BCN Barcelona El Prat | 16,140 | 445 | 208 | 4.05% |
| 2 | MXP Milan Malpensa | 9,547 | 123 | 105 | 2.39% |
| 3 | BRU Brussels | 4,942 | 99 | 18 | 2.37% |
| 4 | PSA Pisa Galileo Galilei | 1,250 | 11 | 15 | 2.08% |
| 5 | NCE Nice Côte d’Azur | 5,258 | 76 | 27 | 1.96% |
| 6 | FCO Rome Fiumicino | 15,110 | 143 | 129 | 1.80% |
| 7 | ORY Paris Orly | 9,308 | 100 | 54 | 1.65% |
| 8 | OTP Bucharest Otopeni | 4,869 | 40 | 40 | 1.64% |
| 9 | NAP Naples | 4,383 | 43 | 28 | 1.62% |
| 10 | VCE Venice Marco Polo | 4,125 | 38 | 28 | 1.60% |
| 11 | BSL Basel Mulhouse EuroAirport | 3,238 | 38 | 12 | 1.54% |
| 12 | LCA Larnaca | 2,299 | 14 | 20 | 1.48% |
| 13 | LBA Leeds Bradford | 1,029 | 8 | 7 | 1.46% |
| 14 | BGY Milan Bergamo | 4,758 | 15 | 51 | 1.39% |
| 15 | KRK Kraków | 4,243 | 17 | 42 | 1.39% |
| 16 | LTN London Luton | 3,357 | 22 | 23 | 1.34% |
| 17 | BRI Bari | 2,607 | 15 | 20 | 1.34% |
| 18 | BLQ Bologna | 3,377 | 24 | 21 | 1.33% |
| 19 | LGW London Gatwick | 7,691 | 57 | 42 | 1.29% |
| 20 | CDG Paris Charles de Gaulle | 20,138 | 155 | 94 | 1.24% |
| 21 | ATH Athens | 7,907 | 60 | 35 | 1.20% |
| 22 | CTA Catania Fontanarossa | 3,841 | 20 | 26 | 1.20% |
| 23 | MAN Manchester | 5,862 | 34 | 36 | 1.19% |
| 24 | ALC Alicante | 6,469 | 25 | 48 | 1.13% |
| 25 | CLJ Cluj-Napoca | 980 | 6 | 5 | 1.12% |
| 26 | VLC Valencia | 3,888 | 15 | 27 | 1.08% |
| 27 | BHX Birmingham | 2,741 | 18 | 9 | 0.99% |
| 28 | CPH Copenhagen | 8,274 | 58 | 20 | 0.94% |
| 29 | ARN Stockholm Arlanda | 5,871 | 50 | 5 | 0.94% |
| 30 | SKP Skopje | 1,061 | 6 | 4 | 0.94% |
| 31 | TIA Tirana | 3,705 | 14 | 20 | 0.92% |
| 32 | LIS Lisbon | 9,927 | 54 | 33 | 0.88% |
| 33 | BUD Budapest | 6,070 | 24 | 23 | 0.77% |
| 34 | MAD Madrid Barajas | 19,257 | 71 | 67 | 0.72% |
| 35 | KTW Katowice | 1,937 | 4 | 10 | 0.72% |
| 36 | VIE Vienna | 10,338 | 44 | 27 | 0.69% |
| 37 | AGP Málaga | 8,547 | 38 | 21 | 0.69% |
| 38 | BTS Bratislava | 1,186 | 1 | 6 | 0.59% |
| 39 | MLA Malta | 3,389 | 1 | 18 | 0.56% |
| 40 | LPL Liverpool John Lennon | 1,245 | 3 | 4 | 0.56% |
| 41 | OSL Oslo Gardermoen | 6,542 | 28 | 8 | 0.55% |
| 42 | CRL Brussels South Charleroi | 1,878 | 4 | 6 | 0.53% |
| 43 | POZ Poznań Ławica | 1,197 | 5 | 1 | 0.50% |
| 44 | WAW Warsaw Chopin | 8,593 | 21 | 21 | 0.49% |
| 45 | WRO Wrocław | 1,730 | 4 | 4 | 0.46% |
| 46 | CIA Rome Ciampino | 1,103 | 3 | 2 | 0.45% |
| 47 | STN London Stansted | 5,639 | 7 | 18 | 0.44% |
| 48 | WMI Warsaw Modlin | 1,087 | 2 | 2 | 0.37% |
| 49 | RMO Chișinău | 2,098 | 1 | 3 | 0.19% |
Country ranking
Disruption rate by country
Departures from every monitored airport in the country, combined. Countries with fewer monitored airports rest on a smaller sample.
| # | Country | Departures | Cancelled | 3h+ late | Disruption rate |
|---|---|---|---|---|---|
| 1 | Belgium (2 airports) | 6,820 | 103 | 24 | 1.86% |
| 2 | Spain (5 airports) | 54,301 | 594 | 371 | 1.78% |
| 3 | Italy (10 airports) | 50,101 | 435 | 425 | 1.72% |
| 4 | Romania (3 airports) | 5,946 | 47 | 47 | 1.58% |
| 5 | Cyprus (1 airport) | 2,299 | 14 | 20 | 1.48% |
| 6 | France (4 airports) | 37,942 | 369 | 187 | 1.47% |
| 7 | Greece (1 airport) | 7,907 | 60 | 35 | 1.20% |
| 8 | United Kingdom (7 airports) | 27,564 | 149 | 139 | 1.04% |
| 9 | Denmark (1 airport) | 8,274 | 58 | 20 | 0.94% |
| 10 | Sweden (1 airport) | 5,871 | 50 | 5 | 0.94% |
| 11 | North Macedonia (1 airport) | 1,061 | 6 | 4 | 0.94% |
| 12 | Albania (1 airport) | 3,705 | 14 | 20 | 0.92% |
| 13 | Portugal (1 airport) | 9,927 | 54 | 33 | 0.88% |
| 14 | Hungary (1 airport) | 6,070 | 24 | 23 | 0.77% |
| 15 | Poland (6 airports) | 18,787 | 53 | 80 | 0.71% |
| 16 | Austria (1 airport) | 10,338 | 44 | 27 | 0.69% |
| 17 | Slovakia (1 airport) | 1,186 | 1 | 6 | 0.59% |
| 18 | Malta (1 airport) | 3,389 | 1 | 18 | 0.56% |
| 19 | Norway (1 airport) | 6,542 | 28 | 8 | 0.55% |
| 20 | Moldova (1 airport) | 2,098 | 1 | 3 | 0.19% |
Routes
Routes with the most disrupted flights
- 1MXP → BCN Milan to Barcelona36
- 2BCN → MXP Barcelona to Milan29
- 3BCN → PMI Barcelona to Palma29
- 4FCO → BCN Rome to Barcelona24
- 5ORY → BCN Paris to Barcelona24
- 6ATH → MLO Athens to Milos23
- 7BCN → CDG Barcelona to Paris22
- 8BCN → FCO Barcelona to Rome22
- 9BCN → LHR Barcelona to London22
- 10CDG → BCN Paris to Barcelona22
Methodology
How these numbers are built
We poll the public departure and arrival boards of 51 European airports throughout the day. A departure counts once the board shows it as operating, departed, landed or cancelled; flights still listed as merely scheduled are left out.
A flight counts as disrupted when it was cancelled, or when it reached its destination three or more hours late — the thresholds in EU Regulation 261/2004. Delays are measured on arrival, not departure. Late flights whose arrival time we could not confirm are not counted, so the rates are conservative.
Airlines are grouped by brand, so subsidiaries flying under one name (for example Wizz Air UK and Wizz Air Malta) count together. Cargo and business-aviation operators are excluded. Days are counted in UTC, and the most recent day is held back until its flights settle.
The compensation figure applies the statutory EU 261 amount for each flight’s distance to one passenger only, and assumes no extraordinary circumstances. It is an illustration of scale, not a forecast of payouts.
Use this data
Cite or download
You are free to republish these figures with attribution under CC BY 4.0. Please link to this page.
SkyPaid, "European flight disruption report: October 2026", https://www.skypaid.eu/flight-disruptions/report/2026-10Airline, airport, daily and route figures (CSV)
FAQ
Questions about this report
- How many flights were disrupted in Europe in October 2026?
- In October 2026, 3,600 of the 270,269 departures tracked at 51 European airports were cancelled or arrived more than three hours late (1.33%). 2,105 were cancellations and 1,495 were delays of three hours or more.
- Which airline had the most disruptions in October 2026?
- By rate, Tunisair: 13.25% of its 400 tracked departures were cancelled or 3+ hours late. Airlines with fewer than 400 departures are left out because a single bad day would dominate their figure.
- Which European airport had the most disruptions in October 2026?
- Barcelona El Prat (BCN): 4.05% of 16,140 departures were cancelled or reached their destination 3+ hours late.
- Can I claim compensation for a disrupted flight?
- Under EU Regulation 261/2004, passengers on a flight that was cancelled at short notice or arrived three or more hours late can be owed €250, €400 or €600 each, depending on distance, unless the airline proves extraordinary circumstances such as severe weather or air traffic control restrictions. Claims can go back several years depending on the country.